The rise of renewables has seen the need for additional firming capacity in order to smooth renewable output and replace coal capacity in the evening peak. The ESB and federal Ministers are currently in discussions regarding the development (or not) of a capacity market for the NEM. Interestingly from the Ministers’ discussions last week, it appears as though any capacity mechanism will likely need to treat renewable and non-renewable (fossil) capacity payments and incentives differently.
The technologies expected to provide this service are hydro, battery storage, and potentially green gas power generation (biogas or hydrogen turbines/fuel cells) in a system that will need considerable firming.
The largest addition of dispatchable capacity to be installed in the NEM is forecast by AEMO in the final 2022 ISP to be Coordinated DER storage.
Under the ISP, coordinated DER will grow from 319MW in 2024 to 9,572MW (roughly equal to the total installed gas capacity in the NEM and 50% of all new dispatchable capacity installed in the NEM, including snowy 2.0) by 2035, which means 40% of all new solar will need to have a storage asset of the same size and all of those batteries have to be registered in a VPP. Or, if we assume that only 50% of those new storage assets would be registered in a VPP, then more than 80% of new solar installations will need to have a battery. Even now, when energy prices are at their most expensive SunWizz and OpenSolar are only seeing about 18% of new solar being paired with storage.
In order to meet those VPP targets, there is a very long way to go. We currently only have 37MW of VPPs registered in 5-min FCAS, which roughly aligns with the 52MW that the 2020 ISP assumes is currently available in the market. In just under two years, however, AEMO expects to see 267MW of additional VPPs or Coordinated DER deployed in the NEM in an environment where incentives for VPPs and registration pathways have been significant barriers.
If coordinated DER doesn’t grow or is unable to respond in the manner anticipated by the ISP, there could be a significant deficit (even if we assume the capacity is available but is only able to cycle once per day). On this basis, if we need to replace 50% of the hours of coordinated DER with an alternative technology that would also qualify for participation in an all-renewable capacity market (without significant de-rating which is how we have seen batteries treated in other capacity markets), hydrogen turbines may be able to play a role.
Other reasons to incentivise other more dispatchable renewable fuels include fuel diversity for reliability and resiliency, scarcity in gas driving prices higher on the east coast, and potential higher-emissions gas used to firm renewables, adding to the carbon budget towards Net Zero.
So how much would we have to incentivise hydrogen turbines to enter the market at an SRMC similar to gas or where the LCOE can be lowered to a level similar to the SRMC of current gas OCGTs?
In 2030, using $15/GJ, we could expect the SRMC of an OCGT to be ~$160/MWh, compared to a hydrogen turbine using $5/kg hydrogen at $437/MWh, significantly higher than an OCGT even with higher gas prices.
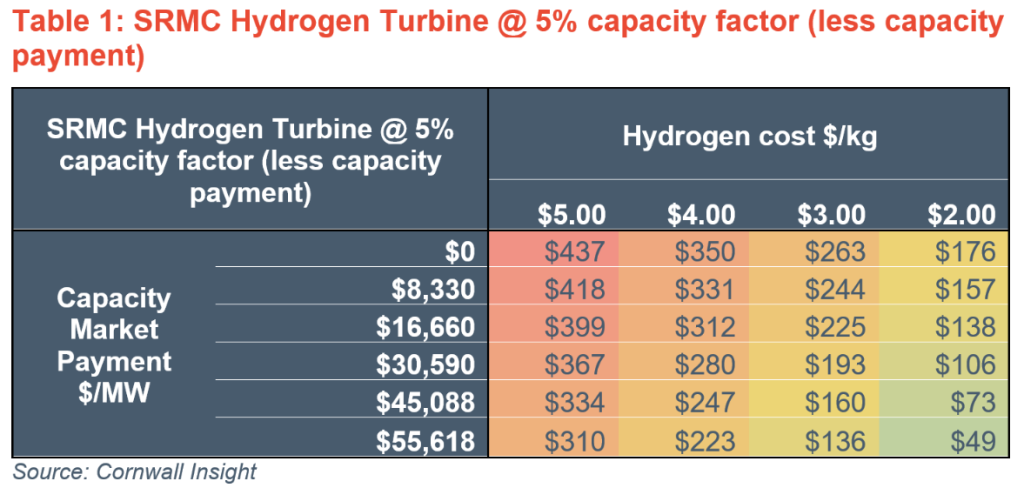
The table above shows the SRMC in $/MWh of a hydrogen turbine at different levels of capacity market payments and hydrogen costs (ranging from $5/kg to $2/kg). The capacity market costs $16,660/MW (the average UK capacity clearing prices for delivery in the 5 years from 2019-2023) and $30,590, the latest market clearing price for the UK capacity market. We see in the table above that hydrogen turbines would need a capacity payment of ~$45/kW (or $45,088/MWh) and consider a reduction to their SRMC to allow their SRMC (at 5% capacity factor) to be driven below the SRMC of $160/MWh for an OCGT in 2030. Interestingly, it also shows that even at $2/kg hydrogen, the SRMC will likely still be $176/MWh just above the SRMC of an OCGT.
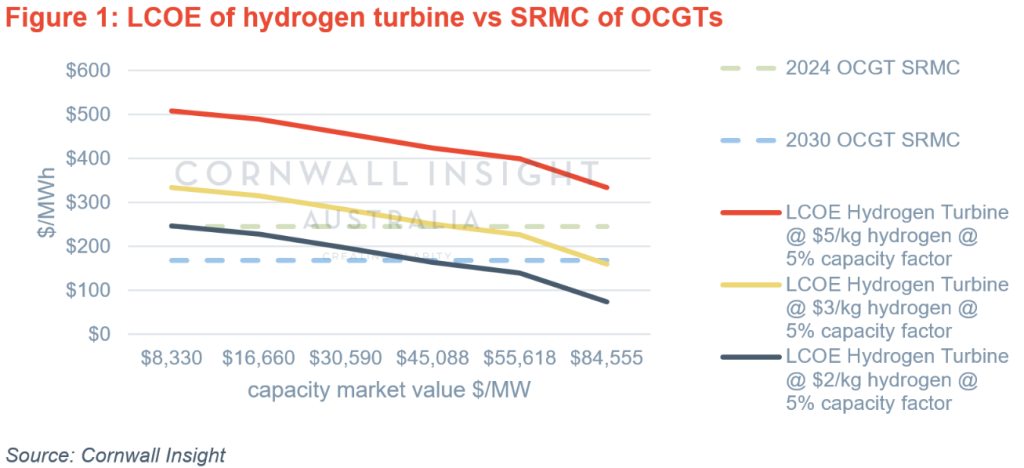
In the graph below, we show the point at which capacity market payments (subtracted from the capital cost of a hydrogen turbine) would alter the LCOE for different hydrogen input costs and ultimately what capacity payment value would push the LCOE of the hydrogen turbine below the SRMC of gas OCGTs in 2030.
Captured prices for OCGTs over the past 5 years have been around $150-$215/MWh, with average historical gas prices oscillating between $5/GJ – $10/GJ. Longer-term gas prices are likely to be around $10/GJ – $15/GJ depending on which forecasts you are looking at, which is a 50% jump from previous gas prices. If gas generators continue to set the market price, we may also expect an increase in the captured prices of peaking generation in a similar proportion to ~$225/MWh – $322/MWh. Dispatch weighted average prices for gas generation across the NEM in our most recent price forecast suggests that gas generation could capture over $200/MWh in 2030, indicating that perhaps a lower capacity payment would be needed if these higher prices could be captured or of hydrogen turbines could also manage to obtain other service payment for system strength or inertia.
Cornwall Insight has recently released our Benchmark Power Curve, which has a detailed view of the NEM over the next 30 years. If you would like further information, please contact us at enquiries@cornwall-insight.com.au.