Price spikes in Queensland: Is solar revenue affected?

In the last few months, we have seen a substantial number of high price intervals in Queensland. Increased Market Demand on 9 March and the simultaneous trip of Gladstone units 3 and 4 on 31 March spiked energy prices to $8,800/MWh and $15,100/MWh levels, respectively. These price spikes occurred between 5pm and 7pm when the share of solar generation was only around 4% of its total daily output. How did these events affect solar revenue?


In this Chart of the week, Andrey Kotov examines how energy contingency events, such as coal units tripping and/or increased market demand, can increase the revenue of large-scale solar based on Q1 2022 observations. Of course, this is still only for a small portion of the time and is not necessarily a daily pattern that solar operators can take advantage of regularly; however, the ability of solar to capture at least some portion of evening peak pricing will be key to its continued long term profitability as midday prices continue to remain low and evening peak prices are expected to become more volatile, which could continue the trend of very low % of solar generation driving very high proportions of total revenue leaving solar project revenues at risk depending on changes to the timing of the evening peak.


As shown in Figure 1, almost 27% of total Q1 2022 quarterly solar farm revenue in Queensland is earned from less than 5% of quarterly energy generation, in only two hours between 5pm and 7pm, suggesting extreme price events (>$10,000/MWh) pushing solar revenue up during this time interval. For Q1 2022, there were 60 5-minute intervals when prices spiked above the $10,000/MWh level between 5pm and 8pm. Assuming the solar farm is not constrained due to the grid stability reasons or any maintenance plans, the last few hours before sunset had the most value of all the hours examined in this analysis.

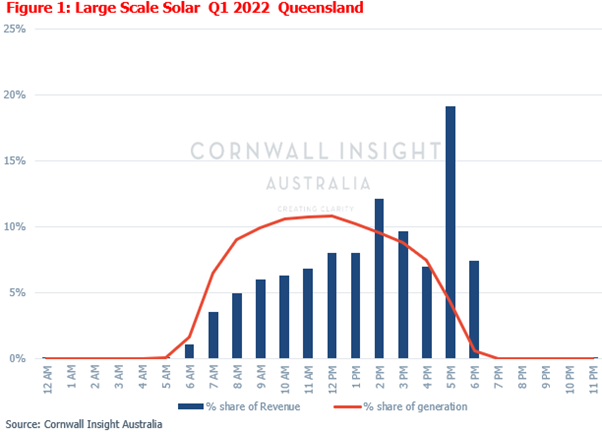
Despite Queensland prices in Q1 2022 averaging $149/MWh, captured prices for solar farms as a proportion of the average Q1 2022 prices were lower and averaged $117/MWh. While this is partially driven by unplanned coal outages and increased market demand in March 2022, it also fundamentally reflects growing daily volatility, especially during summer with evening periods becoming increasingly more valuable.


Going forward, whilst market fundamentals and economics will continue to determine the value spread of intraday pricing and volatility, solar farms will continue to realise a disproportionate revenue benefit (as a % of overall generation) from evening peak pricing events when they occur. Market players with flexible portfolios (solar and co-located battery storage) will have more options to capture price spikes through energy shifting or FCAS markets. For those market players that are 1-2 solar hours behind other competitors (further west of the east coast, like South Australia), their geographical location will likely be of additional benefit, as those assets will likely have higher generation volume and be able to better capture those evening peaks.


Cornwall Insight Australia’s in-house Benchmark power curve price forecast subscription services shed light on how prices are likely to evolve, considering the impacts of new regulations. For more information, please contact us at enquiries@cornwall-insight.com.au.

To keep reading, please log in to your account

Related thinking

Energy storage and flexibility

R1 and L1 revving up the BESS revenues

In our ‘The VFF… Very Fast and Financially rewarding market so far’ Chart of the week, the two new contingency markets, the Very Fast raise contingency FCAS market and the Very Fast lower contingency FCAS, were analysed and demonstrated the high participation of big batteries along with VPPs and DERs....

Low carbon generation

An investigation into REZ capacity factors during Victoria’s dark doldrums

As the grid transitions to much higher levels of renewable penetration, the range of generation outcomes on any given day increases. The worst of these ranges are known as dark doldrums when there is a combination of poor conditions for wind and solar generation, usually a windless day in winter....

Commercial and market outlook

The VFF… Very Fast and Financially rewarding market so far

On 9 October 2023, 1pm (market time), we saw the start of two new contingency FCAS markets. The Very fast raise contingency FCAS market, and the Very fast lower contingency FCAS. Upon commencement of the VF FCAS market, a commissioning period of two weeks with an initial max requirement of...

Commercial and market outlook

Is the sun setting on utility solar?

The Federal Government has legislated emissions reductions of 43% below 2005 levels by 2030. Sourcing electricity from renewable technologies is fundamental to meeting this, with a much-publicised target of 82% renewables in the grid by 2030 – up from a current value of 38% over the last year. Fortunately, the...

Commercial and market outlook

The Very Fast FCAS market is about to commence – a look at a possible time-of-day profile for R1

On 9 October 2023, 1pm (market time), the dispatch of the new Very Fast (VF) FCAS market in the NEM will commence and will add two new markets for contingency FCAS, Raise 1 (R1) and Lower 1 (L1). AEMO has released a final industry go-live plan to keep track of...

Low carbon generation

“Ooh, a storm is threatening, My very [interconnection] today”: Can states utilise interconnection to share wind resources?

Penetration of renewables continues to dominate the energy news, as we saw renewables as a proportion of total demand reach new heights this week to a new record of ~70% penetration. In light of this continuing march toward a renewable-dominated grid (building on some analysis we did in Chart of...

Energy storage and flexibility

How long is the ‘Golden time of day’ for batteries?

A key part of the business case for grid-scale standalone batteries is the arbitrage opportunity between low daytime wholesale prices (when renewable energy generation from solar is plentiful) and high evening prices (when the sun goes down and household demand ramps up quickly). The share of battery revenue coming from...

Low carbon generation

MLF changes in NSW in the past decade

MLF, short for Marginal Loss Factor, represents the portion of electricity losses that occur along the transmission network between a connection point and the Regional Reference Node (RRN). Within the NEM, the MLF serves as a metric to quantify these losses along the network, playing a pivotal role in determining...