Latest Marginal Loss Factor (MLF) forecasts

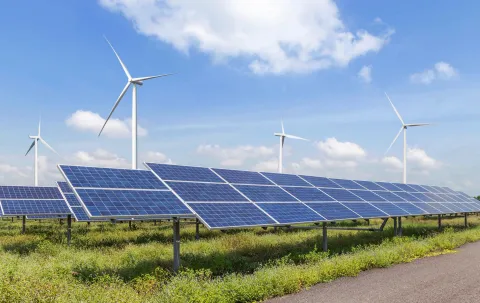
Cornwall Insight Australia recently launched our Marginal loss factor (MLF) curve subscription insight service.

The MLF curve provides future projections of MLF throughout the NEM, allowing clients to be better informed of likely MLF trajectories for both current projects and be able to benchmark MLFs for projects under development. The MLF curve includes projections for all current generators in the NEM and selected TNI points in Renewable Energy Zones (i.e., sub-regional REZ locations).

Below are two redacted charts from the report of the MLF forecast and TOD average loss factors for the South-West NSW (N5) REZ.

In this REZ, generators in the South-West section of New South Wales have lower MLF values due to increased power flow from the area’s connection point. This is caused by excessive localised generation combined with a troubled path to the load centre, leading to generator output travelling towards the RRN. System strength and reliability challenges have also impacted outcomes due to inverter-based resources.

Below is an excerpt of the potential impact of different scenarios on site MLF for the South-West NSW (N5) REZ.

Below is an excerpt of the investor assessment on South-West NSW (N5) REZ buildout capacity.

Investor assessment on South-West NSW (N5) REZ buildout capacity (excerpt)

  • Area a dead zone for generation in the short term due to system curtailment, increased economic curtailment and reducing marginal loss factors
  • These constraints are somewhat alleviated with EnergyConnect comes online, although risks arise from transmission upgrades stopping at Wagga Wagga and reduced flow when TUMUT3 operates
  • Due to poor MLFs and high economic curtailment for solar in this region, and peak time competition potentially reducing upside for wind and storage, it is recommended that the area be approached carefully
  • Storage assets pose the highest value with potential looming curtailment markets. However, solar and wind will likely need more certainty around the future of the Snowy 2.0 rollout to see further upside
  • Network curtailment is forecast to decrease significantly once all four transmission upgrades are complete (EnergyConnect, Snowy, Humelink + South-West stability upgrades). The timing of these upgrades needs to be weighed against the increasing levels of self-curtailment by VRE projects in NSW due to rooftop PV, with an additional downside risk of lower than typical MLFs given the proximity to other generators towards the node.

The report contains quarterly analysis of specific REZ zones including sit location and project details, MLF profile, factors that impact the MLF forecast, and investor assessment on REZ buildout capacity. 

We can send you a copy if you’re interested in receiving a sample of the MLF curve.

Related thinking

Announcement

New South Wales REZ outlook

From Cornwall Insight Australia's Energy Market Perspective Our quarterly Energy Market Perspective contains an analysis of indicative capacity at REZ zones throughout the NEM.  The following assessment for NSW is from our latest edition. Request Energy Market Perspective call back The strategic development of Renewable Energy Zones (REZs) in New...

Announcement

Capacity Investment Scheme boosted from 6GW to 32GW

From Cornwall Insight Australia's Energy Market Alerts service Last Friday, the Commonwealth announced a major boost to the Capacity Investment Scheme, with the scheme now expected to deliver 32GW (combination of 9GW firming capacity and 23GW renewable generation) – up from 6GW. Cornwall Insight Australia has released an Energy Market...

Announcement

What are Australia’s emissions reduction targets?

From Cornwall Insight Australia's Energy Market Alerts service Energy laws have now been amended to incorporate an emissions reduction objective alongside the other objectives. The list of targets that the market bodies will need to consider is listed in a separately published Targets Statement. The targets currently listed cover both...

Announcement

Energy prices tumble in October

From Cornwall Insight Australia’s NEM Market Analysis report With over 700 GWh of rooftop PV added to the NEM since October last year, records were again set in NEM minimum demands along with a high instantaneous renewable penetration within the grid of 71.4%. Once again, the month’s main story was...

Announcement

Emissions intensity drops for October 2023

From Cornwall Insight Australia’s NEM Market Analysis report This October saw a 12.6% reduction in total emissions (accounting for -1.18 Mt CO2-e reduction) as solar and wind generation has increased significantly. The reduction in emissions may continue with the arrival of Fly Creek and Rye Park wind farms expected soon...

Announcement

Latest FCAS Q3 price forecast released

Cornwall Insight Australia released the latest Frequency Control Ancillary Service (FCAS) price curves for Q3 2023 on 21 September 2023. Available to download is an excerpt reporting the headlining power price trends from the FCAS insight service. NEM FCAS markets in Q1 and Q2 of 2023 saw lower overall costs,...

Commercial and market outlook

NEM power price trends | Q3 2023

Cornwall Insight Australia has released our latest NEM Benchmark power curve (BPC) for Q3 2023 to our insight service subscribers. We have released a free excerpt, which you can access below. The future of the energy transition requires substantial new generation, which means increasing the size of the skilled workforce, speeding...

Low carbon generation

De-risking renewable development: CI RESS Model inspires policy changes in RESS 3 T&Cs  

Last year, we partnered together with Wind Energy Ireland (WEI) to produce a report titled “Improving Revenue Certainty and Risk Allocation for New Renewable Generators”, which explored potential auction policy changes for the RESS auction that would help de-risk renewable investment for developers and generators. At the heart of this...