CI Live 2026 - Save the Date
CI Live is back, bringing together leaders from across the energy sector on 4 November for a day of in-depth insight and debate at Glaziers Hall, London.

CI Live is back, bringing together leaders from across the energy sector on 4 November for a day of in-depth insight and debate at Glaziers Hall, London.
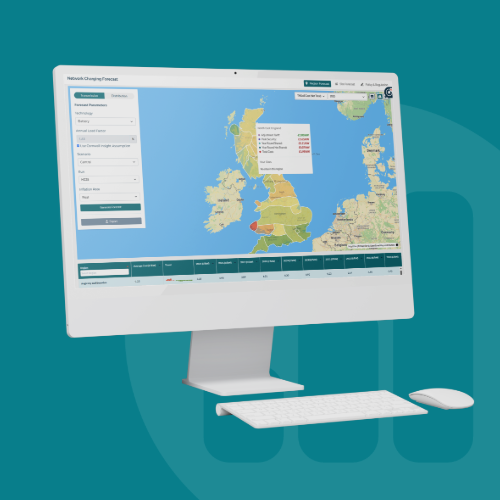
Newly enhanced expert long-term forecasting for network use of system charges & revenues

Commercial due diligence–style market forecast of wholesale power prices, capture rates, and IRRs

Be the first to hear about market updates, insights, and the latest events from Cornwall Insight
Our research, consulting and training builds capacity for the delivery of net zero, creating common purpose with our customers, and a shared commitment to reshaping the energy world of tomorrow.

We’re committed to bringing down our emissions to net zero by 2035. Learn more

One of the Financial Times leading UK management consultancies in the energy, utilities and environment sector for five years. Learn more

We are proud recipients of an Investors in People Silver Accreditation, highlighting our commitment to workplace excellence. Learn more

Members of the internationally recognised CPD Certification Service, a powerful learning tool that is focused on improving skills, ensuring qualifications are up to date, and ensuring an empowering approach to career progression.


Cornwall Insight's latest blog sets out why business electricity costs continue to rise across every part of the bill, and what this means for businesses planning and budgeting ahead.
Read More
Market-wide Half-Hourly Settlement (MHHS) represents one of the most significant reforms to GB electricity settlement in decades.
Read More
The Government announced it will introduce new measures to decrease the pressure that gas exerts on the electricity price in Great Britain. What does this mean?
Read More
This paper is intended to provide analysis to support NESO in its consideration of the potential impacts of changing Gate Closure in line with the stated purpose of the Call for Input
Read More
Navigating life after the Renewables Obligation (RO) and the challenge of sustaining revenues. From March 2027, the earliest RO-accredited assets will begin to roll off the scheme, marking a major turning point for renewable generators. With no single replacement subsidy in place, asset owners face increasing pressure to identify viable routes to market once RO support ends.
Read More
. Cornwall Insight analyst Alex Livingston explores how a series of rapid escalations have pushed wholesale gas, power and oil prices higher, the role of tightening supply constraints, and why the post-Ukraine energy landscape may have helped cushion the overall impact.
Read More
Geopolitical tensions in the Middle East are sending ripples through global energy markets, and the effects are now being felt at home.
Read More
The latest round of Capacity Market auctions saw both the T‑1 and T‑4 auctions clear at multi‑year low prices, marking a significant shift from recent years in which clearing prices have consistently landed at much higher levels.
Read More
Tension in the Middle East is sending ripples through global energy markets and Ireland is feeling the impact.
Read More
The past two weeks have seen escalating conflict in the Middle East. Below is a brief overview of what has happened, and why energy markets are watching developments so closely.
Read More
Fill in your details and we will get back to you as soon as possible with more information about our solutions.