For the first time in 30 years, Australia’s highest-selling mid-size vehicle is not a Toyota Camry – running an internal combustion engine (ICE). As reported by 7 news, it has been replaced by the Tesla Model 3.
This piece of information demonstrates that the EV uptake in Australia is achieving much faster growth than in previous years. However, as Behyad Jafari (CEO of the Electric EV Council) said in their August 2022 Summit, the chance of buying an electric car in today’s Australian EV market is less than winning the ‘lottery’ because of the significant supply constraints despite the high demand for EVs. While this highlights that ICE cars are losing their popularity among Australians, one of the questions it raises is the effect of the EV charging load on the National Electricity Market (NEM). This question will need to be considered in the context of grid planning and real-time operation.
This Chart of the week provides insights on the upcoming EV charging load using results from Cornwall Insight Australia’s in-house EV uptake model. This model considers the cross effects between population and the level of EV uptake on the charging load demand of EVs in NEM. Chart 1 shows the profile of EV uptake in different NEM states and by EV type.
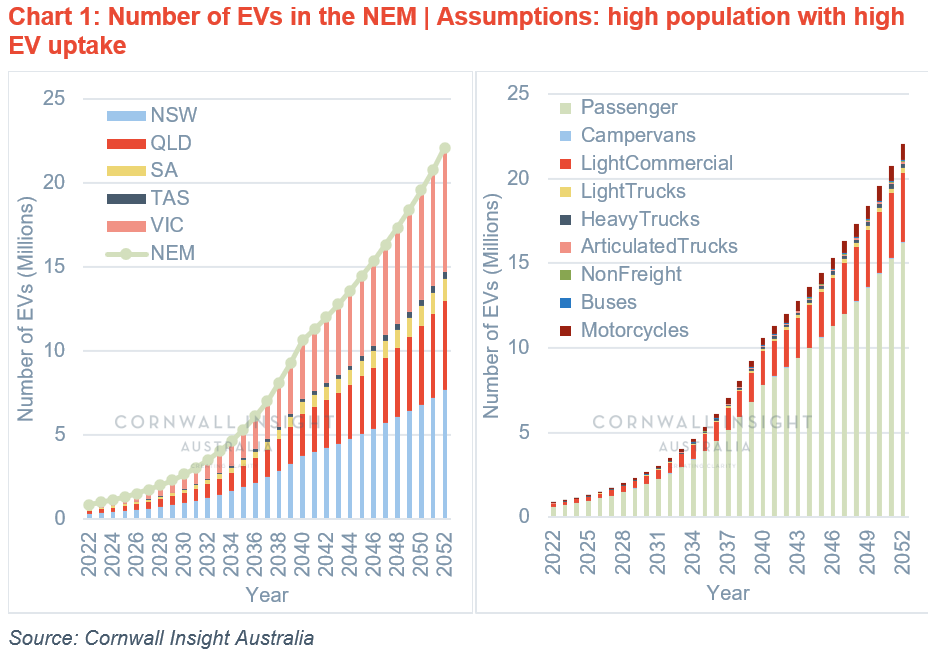
From Chart 1, we can see that 22 million cars are expected to be in the EV fleet of NEM States up to the year 2052, for the extreme scenario of high population (based on the Australian Bureau of Statistics) and high EV penetration (98% of total cars in Australia). NSW, VIC, and QLD have major shares of NEM EVs, while SA and TAS should manage much lower EV loads. This can be an opportunity for SA and TAS as both states have a very high potential for renewable-based generation and exporting to high EV-demand states if enough interconnector capacity is available. However, the challenge of EV load for the market operators is that many EV owners may prefer convenience charging (i.e., charging EVs during evening peak hours when they reach home after work). Therefore, it is crucial to target some groups of EVs to shift their charging pattern to high renewable generation hours (mid-day or early morning) to alleviate the EV load stress on the grid.
Based on Chart 1, passenger EVs with around 16 million cars in the year 2052 cover around 70% of total EVs in the NEM. Therefore, this group seems to have the most potential for levelling EV charging load among other EV groups. Additionally, passenger EV owners may enjoy high flexibility to change their charging hours if grid operators offer them a considerable incentive. However, there is another fact about different EV groups that the market operator needs to consider: the total EV loads of some EV groups are highly disproportionate to their EV numbers. This is clearly illustrated in Chart 2, where articulated, heavy, and light trucks have an outsized share of total demand despite covering only 3% of EV numbers.
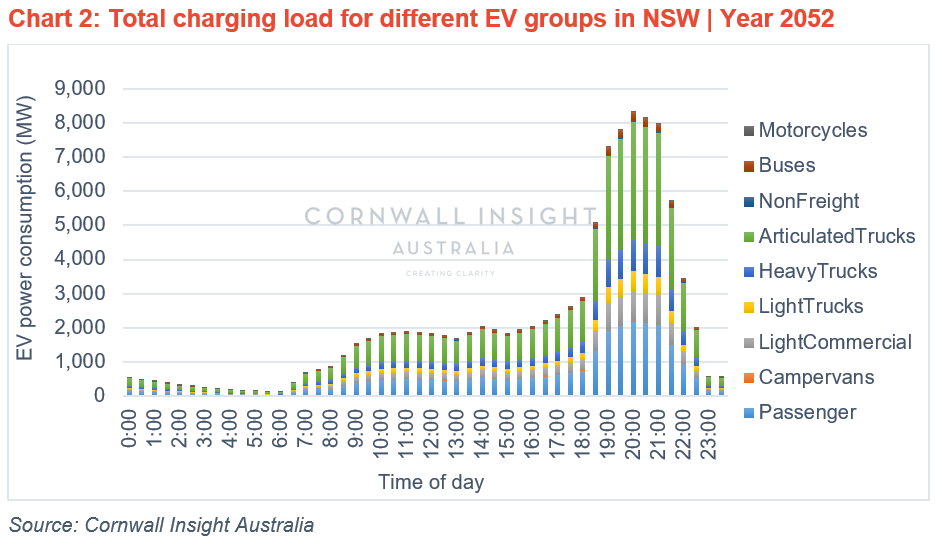
The basis for this outperformance is that trucks travel long distances annually. For example, according to the Australian Bureau of Statistics, articulated trucks travel around 79 thousand kilometres yearly, more than any other vehicle type. Therefore, grid operators should expect an outstanding challenge in the next 30 years when realising that around 60% of EV loads will come from trucks. If appropriate incentives can be found to promote the use of off-peak charging for this EV group, it could be a potent solution to alleviate the stress on the network by targeting the relatively smaller cohort that makes the biggest contribution to grid demand rather than targeting a very large number of passenger car users.
So, what could be the scale of the problem if EV charging isn’t managed? Chart 2 shows an approximate 8,000MW total demand for dispatch intervals 19:30-21:00 for NSW in 2052 using our internal modelling. To put this number into context, the current NSW evening peak is 10,000 MW. Therefore, failure to properly manage EV charging may lead to significant augmentation investment required to manage the increased load during peak periods. Anyway, the golden era of ICE cars has undoubtedly ended, and we have no choice but to start planning for the new NEM participants: electric vehicles.
A more in-depth market analysis of the effect on the NEM of EVs in different States can be performed using Cornwall Insight Australia’s EV uptake model. For more information about the model, please contact us at enquiries@cornwall-insight.com.au.