A key part of the business case for grid-scale standalone batteries is the arbitrage opportunity between low daytime wholesale prices (when renewable energy generation from solar is plentiful) and high evening prices (when the sun goes down and household demand ramps up quickly). The share of battery revenue coming from energy arbitrage will be even more crucial in the future as the market price for frequency control ancillary services (FCAS) is forecasted to decline with time. As such, as time goes on and market dynamics shift around, the length and timing of this evening peak pricing window can change with it, significantly affecting the potential returns of the battery asset.
In this Chart of the week, we explore how these shifts may play out by looking at the average daily revenue profile for a grid-scale standalone battery trading on a merchant basis. 100 MW batteries of 2hr storage capacity[1] have been modelled in four NEM regions (excluding TAS) using our Storage investment model (SIM). The SIM maximises the net operating profit for each trading day, optimising the dispatch of the battery in each market (wholesale + 8 FCAS) for each half-hour interval. The annual average time-of-day revenue profile for 2hr batteries is presented in Figure 1 for each of the four regions in 2025, 2030, and 2035.
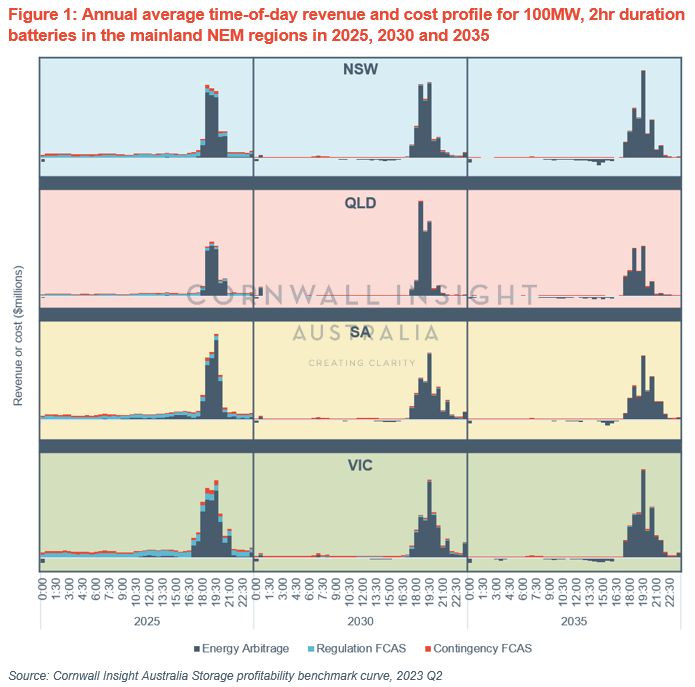
The following general trends are observed:
- Revenues for discharge in the evening peak demand are generally similar across all regions, with the main exception of QLD in 2030. In this instance, an assumed delay to the build-out of pumped hydro from the Queensland Energy and Jobs plan has the effect of requiring coal-fired power stations to remain operational for longer. This has the flow-on effect of requiring additional firming capacity via long-duration batteries to ensure system reliability, placing upward pressure on prices.
- The length of the window in which the battery is typically discharging the evening peak (dark blue) gets wider as time goes on – from 2.5-3.0 hrs in 2025 out to 4.0-4.5 hrs in 2035, as electrification of heating loads and transportation drives demand upwards at times that solar generation cannot serve. This indicates that longer-duration batteries can be expected to make greater revenues from arbitrage over time as the peak window lengthens.
- Currently, charging costs are generally incurred during the daytime hours or early morning. These costs increase over time as the incidence of negative prices falls away. Average daytime prices rise as coal-fired power plants retire and the LRET expires in 2030.
- FCAS revenues (light blue for Regulation, red for Contingency) are obtained across the day in 2025, generally favouring Raise services over Lower services. These revenues fall away through 2030 and 2035 as more new storage projects enter the market and compete with each other, saturating the markets as each provider captures a smaller proportion of the total FCAS requirement (which is assumed not to grow as fast as the sum of the capacity provisionable). Note that this does not consider the effect of the proposed mandatory Primary Frequency Response obligations on batteries, which may act to lower Regulation FCAS revenues relative to those depicted here.
This analysis is one part of our new Storage profitability benchmark curve (SPBC), a quarterly report that combines the insights from our latest Benchmark power curve (BPC) forecast with the dispatch optimisation from our Storage investment model (SIM). The SPBC provides investors and developers with an outlook on the expected financial performance of a generic battery asset and how this may vary by region, storage duration and build year. For more information, please contact enquiries@cornwall-insight.com.au.
[1] Key modelling assumptions:
- Battery commercial operations commencement on 1 January 2025
- Battery registered to provide up to 50MW of Regulation FCAS and 52MW of Contingency FCAS (average recent Contingency FCAS registration of other market batteries in the NEM)
- Fixed 85% round-trip efficiency
- Benchmark power curve 2023 Q2 Neutral price forecast