Zap, Crackle, Pop! SA’s shocking electric dance party on the 11th

Across the mainland states in the NEM, South Australia (SA) relies heavily on variable renewable energy (VRE) resources. SA is an excellent subject to test the premise “What if the wind doesn’t blow, and the sun doesn’t shine”?

Negative spot prices persist in South Australia due to an abundant supply from renewable generation and low operational demand. In our latest Energy Market Perspective, we have observed that during this quarter, negative or zero prices were observed in 9% of dispatch intervals, marking a new Q2 record high and representing an increase of five percentage points compared to last year’s quarter. South Australia experienced 17% of quarterly spot prices at or below $0/MWh, seven percentage points higher than the previous Q2.

In this Chart of the week, we are investigating the market price cap event that happened in SA on 11 August. It was an electrifying Friday night party for the South Australian market as it was the first time the spot prices hit the market price cap back-to-back recently.

The graph below shows the exports, imports, price, wind availability, and other conventional generators’ operation on 11 August 2023 in SA.

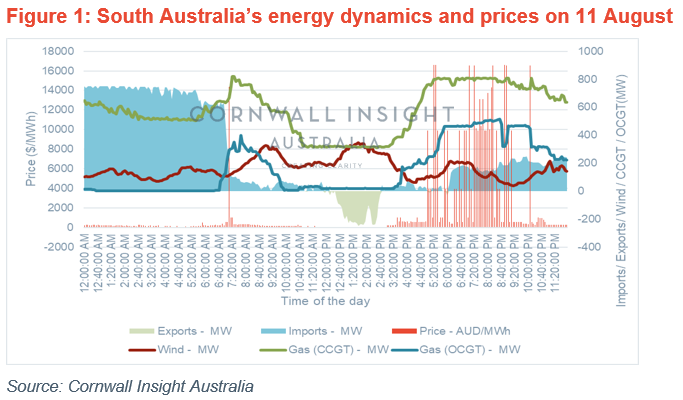
Between 5:25 pm and 5:30 pm, the price spiked to the $16,600/MWh market price cap. While it is expected for demand to peak in the early morning and evenings, hitting the market cap on two separate occasions in one evening deserves attention.

From the graph, it can be seen that there is a considerable reduction in the wind during the evening. This might have led to the supply-demand imbalance as a fair share of SA’s energy is from wind. However, there was a dip in imports around the same time. This dip was caused by an outage on one of the Southeast-Tailem Bend 275kV lines, which resulted in reduced interconnector capacity on the Heywood Interconnector. With AEMO issuing multiple Lack of Reserve (LOR) notices for SA throughout 11 August. It appears there was a minor bottleneck being caused by the outage, reducing the ability from Heywood, and generators within the region (Snuggery, Ladbroke, Lake Bonney, and Canunda), limiting extra capacity towards the node, noting this outage lasted six days from 11 August. Later to spice things up at around 8:50 pm, all the operating units of the Snapper Point Plant tripped, again leading to a price spike of $16,600/MWh.

While recent reforms like the Green paper focus on SA developing a hydrogen export industry, these events in August are a reminder that high volatility will continue to be a feature of the current energy market.

For more information on price trends and energy balance figures, our Energy Market Perspective may be of interest. For more information on the energy market and power systems modelling or other services, please contact enquiries@cornwall-insight.com.au.


To keep reading, please log in to your account

Related thinking

Energy storage and flexibility

R1 and L1 revving up the BESS revenues

In our ‘The VFF… Very Fast and Financially rewarding market so far’ Chart of the week, the two new contingency markets, the Very Fast raise contingency FCAS market and the Very Fast lower contingency FCAS, were analysed and demonstrated the high participation of big batteries along with VPPs and DERs....

Low carbon generation

An investigation into REZ capacity factors during Victoria’s dark doldrums

As the grid transitions to much higher levels of renewable penetration, the range of generation outcomes on any given day increases. The worst of these ranges are known as dark doldrums when there is a combination of poor conditions for wind and solar generation, usually a windless day in winter....

Commercial and market outlook

The VFF… Very Fast and Financially rewarding market so far

On 9 October 2023, 1pm (market time), we saw the start of two new contingency FCAS markets. The Very fast raise contingency FCAS market, and the Very fast lower contingency FCAS. Upon commencement of the VF FCAS market, a commissioning period of two weeks with an initial max requirement of...

Commercial and market outlook

Is the sun setting on utility solar?

The Federal Government has legislated emissions reductions of 43% below 2005 levels by 2030. Sourcing electricity from renewable technologies is fundamental to meeting this, with a much-publicised target of 82% renewables in the grid by 2030 – up from a current value of 38% over the last year. Fortunately, the...

Commercial and market outlook

The Very Fast FCAS market is about to commence – a look at a possible time-of-day profile for R1

On 9 October 2023, 1pm (market time), the dispatch of the new Very Fast (VF) FCAS market in the NEM will commence and will add two new markets for contingency FCAS, Raise 1 (R1) and Lower 1 (L1). AEMO has released a final industry go-live plan to keep track of...

Low carbon generation

“Ooh, a storm is threatening, My very [interconnection] today”: Can states utilise interconnection to share wind resources?

Penetration of renewables continues to dominate the energy news, as we saw renewables as a proportion of total demand reach new heights this week to a new record of ~70% penetration. In light of this continuing march toward a renewable-dominated grid (building on some analysis we did in Chart of...

Energy storage and flexibility

How long is the ‘Golden time of day’ for batteries?

A key part of the business case for grid-scale standalone batteries is the arbitrage opportunity between low daytime wholesale prices (when renewable energy generation from solar is plentiful) and high evening prices (when the sun goes down and household demand ramps up quickly). The share of battery revenue coming from...

Low carbon generation

MLF changes in NSW in the past decade

MLF, short for Marginal Loss Factor, represents the portion of electricity losses that occur along the transmission network between a connection point and the Regional Reference Node (RRN). Within the NEM, the MLF serves as a metric to quantify these losses along the network, playing a pivotal role in determining...